Lorem ipsum dolor sit amet, consectetur adipiscing elit. Etiam vel risus imperdiet, gravida justo eu.
After many years of research, our QST technology allows us to present an approach that is both innovative and groundbreaking. These design breakthroughs in software code application and our Scalar Vortex Miracoil process have qualified us for a patent pending status.
An overview of our award-winning software design approach includes but are not limited to:
Software code that allows us to capture and maintain the “INTENT” of the speaker. Conventional programmers have always relied upon a simplistic divisible by two processes.
Formulation of original code which creates 147 decimal points of resolution while capturing and analyzing 1,522,008,064 bits of information. This was accomplished by eliminating the reliance on the mechanical dependency of the computers A/D (audio to digital) converter. We succeeded in writing the entire process in the original code.
Generation of a complicated interference patterns exceeding six waveforms. Most other conventional boilerplate technologies simplistically beat two waveforms or frequencies together. In contrast, the interference pattern we generate exhibits dynamic shifting in four-dimensional space (the three spatial dimensions plus time). By the use of a proprietary phasing equation, we are able to manipulate the Scalarwave energy construct so that it maximizes the impact on the receiving system, the end user. As part of this, the receiver experiences new phenomena such as phantom sounds and tones which indicate that there is an expansion of dendrites in the brain. These phenomena are an indication of an increase in consciousness.
We use a short time Fourier transform, which means that we essentially break up the sample into a number of smaller samples which can be analyzed and broken into a sum of sinusoidal. However it is not enough to simply break down the sample into a non-overlapping set of smaller samples, there is some framing that must be done, in our processing the sample windowing is overlapped by 75%. This provides for a smoother scaled output signal without a large number of signal artifacts, which would otherwise be present at the boundaries of our processing sample size. The processing sample size is set at 20ms which provides for a small enough sample so that we can use a Short Time Fourier Transform to generate our scaling data since over 20ms of time the signal will not significantly change in the time domain.
Using the STFT (Short Time Fourier Transform) we generate a Frequency Domain analysis of the signal by generating an array of bin frequency analyses. Our bin frequencies are separated by 48hz to provide maximum resolution in the Frequency Domain. We probe our 20ms sample for each of our bin frequencies resulting in a Magnitude, Frequency, and Phase result.
We then do some additional processing to manage phase shifts, which occur due to the fact that our input sample frequencies are not spaced exactly 48Hz apart. When a sampling frequency participates in more than one bin frequency probe the phase of the resulting output will shift. We take this into account in our processing by the use of an algorithm designed to take the phase difference in our bin processing output and apply it to the Magnitude of the frequency and shifting the phase of the output to be coherent with the expected phase.
Then it is a simple matter to take the median frequency domain analysis of the input sample and our target frequency and arrive at a scaling factor. This scaling factor is applied to the frequency result of our processing. We then process the results of our processing using an Inverse Fourier Transform which basically takes our processed set of sinusoidal frequencies and regenerates a complex waveform that has been frequency shifted. We use this Alpha – Theta – Delta information to imprint the Structured Water via lossless frequency audios on high fidelity audio players.
Overriding A/D Sampling Limitations
Sampling Resolution
Our application takes audio samples at a rate of 44,100 samples per second with an amplitude resolution of 16 bits giving 65,536 discrete amplitude steps per sample. This hifi quality sampling rate ensures that all available frequency and amplitude information in the voice is collected and analyzed. Sampling at this rate results in a data set that is able to represent frequency information where the Nyquist frequency is 22,050 kHz, well above the range of human speech.
Analysis
Our application applies a standard Fast Fourier Transform to the mathematical representation of the voice sample data to convert the information in the time domain as it is represented by the sample data collected from the user to a data structure representing the same information in the frequency domain. This is an industry standard analysis function used by all the spectrum analysis tools available today.
We supplement the utility and resolution of the FFT (Fast Fourier Transform) by the use of a specialized and custom arithmetical mathematics library that allows for a far greater degree of resolution than currently available in commercial math libraries. Our application also applies a variant of the FFT algorithm to the input data called the Goertzel Transform. The Goertzel Transform is mathematically related to the FFT but acts on only a single frequency, allowing us to apply a different algorithm to the same data and increasing again the accuracy of our analysis. The combination of these two algorithms is unique to our approach and to this writer’s knowledge is not used commercially in any other product.
Both the FFT algorithm and Goertzel algorithm we have developed are modified to work against an intermediate data representation that expands and extrapolates the data contained within the voice sample. This is required due to the way that these algorithms work. Both algorithms result in a series of bins each bin contains two complex numbers that can be further manipulated mathematically to produce a frequency/intensity value. It is this value that is used subsequently in our analysis algorithm.
Due to mathematical constraints, the size and thus resolution of this set of bins is one half of the sample size. An analysis set size of 1024 samples will result in the entire frequency domain map spanning only 512 bins; each of these bins, therefore, will contain information regarding 43.06 Hz of the frequency spectrum – obviously very low resolution. This is the type of frequency domain analysis used by media player visualizations and by some other spectrum analyzers on the market.
Our application uses a technique whereby the output range is vastly increased resulting in an output structure that contains over 1,099,511,627,776 bins. These bins are mathematically represented with a proprietary format and method that requires virtually no storage on the sample processing computer. This representation allows us to analyze voice data at a resolution which would otherwise require more storage per sample window that is present on any modern day computer. Our sample resolution results in each bin containing frequency information about .00000002005 (2.005E-8) Hz of the frequency spectrum – as you can see this allows us to more accurately gain information about the frequency spectrum of a sample since each bin represents such a small section of the entire spectrum.
Comparison with Hardware Spectrum Analyzers
It is difficult to compare our mathematical approach to a hardware-based approach simply because of the limitations of the hardware-based method. Hardware methods have a resolution that depends on the cost and complexity of the circuitry used to generate the frequency domain data. Hardware-based approaches use a resonant filter circuit for each bin that filters out intensity information not configured for that filter. For each individual frequency the hardware system analyses there must be a single corresponding circuit. Due to the physical nature of these circuits, there is a small upper limit on the number of bins that a hardware-based system is able to provide whereas our software-based system is virtual in nature and relies on mathematical concepts for its representation and analysis allowing us practically unlimited resolution.
Synthesis and Remapping
Our synthesis engine is also mathematically based on trigonometric functions that output waveform data directly and allow us to modify and control the phasing of individual components of the synthesized audio. Other applications rely on wavetable synthesis whereby the output waveform is stored in small chunks (the wavetable) and simply copied out to the output data. Wavetable synthesis is faster but results in aliasing of output data as a result of scaling which must take place to generate waveforms of a different frequency than what is stored in the wavetable. Our method generates a smoother, more natural sounding output. Being able to modify the phasing of component waveforms also allows us to generate with a great precision beating of the signals.
It is this beat frequency generation that results in the great impact our system has on the user. By the application of a proprietary algorithm, we are able to tune the standing wave generated inside the user’s brain. A standing wave is an interference pattern generated when two or more waveforms interact. The important thing about standing waves is that they apply energy to a single spot continuously whereas a regular waveform applies energy only for a brief period during each cycle. Manipulation of the phasing of the component signals allows us to generate standing waves inside the neural circuitry of the user’s brain to initiate and sustain immensely powerful change.
However, our system does not simply beat two frequencies; the output waveforms are complex and contain more than simply two waveforms. We generate a complicated interference pattern comprised of more than 6 waveforms and the interference pattern thus generated exhibits dynamic shifting in four-dimensional space (the three spatial dimensions and time). By the use of a phasing equation, we are able to manipulate the Scalarwave energy construct so that it maximizes the impact on the receiving system – the user.
Conclusion
Adding your personal frequencies to the IQubes brings more smoothness and balance into your life while accelerating personal growth. We encourage you to take a closer look at our new Quantum Sound Therapy software and see how simple it is to use. Self-empowerment is really this easy.
GDV Biofield Testing for Quantum Sound Therapy
At: ACEP Energy Psychology Conference
Date: 6-2-2013
Background
The Quantum Sound Therapy (QST) process was informally evaluated in this study. QST involves taking a 15-second sample of the voice, analyzing it using a proprietary algorithm and delivering a 32-minute session of sound frequencies specifically designed to release deep stress from the Subtle energy field and restore balance to the emotional, mental and causal body. The balancing sound frequencies or tones were delivered through the Theta Love iQube which is a quantum energy instrument based on 3 miracoils, inert noble gases, light, sound frequencies and sacred geometry. The client holds an external Quantum Sound Therapy miracoil during the quantum sound therapy session. The Chakra Balancing iQube is reported to stimulate and balance the body’s human biofield energy systems and create a feeling of well being as well as an increase in physical and emotional energy. Voice analysis is used to produce customized healing tones for each subject. Further, the major systems of the body can benefit from the healing energy of the iQube. Based on the results of this small pilot study, many of these claims were proven to be correct.
GDVsource measured a small group of 4 subjects who were participating in the ACEP Energy Psychology Conference in the Exhibition Hall in Reston, VA.,
GDV Measurement Procedure
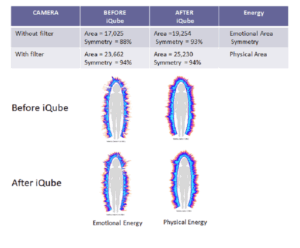
A Gas Discharge Visualization (GDV) Electrophotonic Kirlian camera was used to capture the images. The fingertips of all subjects were captured one finger at a time, beginning with the right thumb without a cellophane filter over the lens. This reading provided information about the psycho-emotional energy information. Perspiration and oils, which are a nervous system response, were not blocked by through the use of a filter.
The filter was then placed on the lens to capture the physical energy response. The capture of the ten fingers was repeated. The captures were then calculated in a proprietary suite of software programs for numerous measurements including intensity, form coefficient, entropy, integral area, and activation coefficient, to name a few. The results were then evaluated in the three primary diagnostic programs: GDV Diagram, GDV Energy Field, and GDV Chakra.
Subject 1: female – 56 years-old; Occupation: CEO, Master Acupuncturist & Colorpuncturist
Subject 2: female – 42 years-old; Occupation: Registered Nurse & Master Acupuncturist & Colorpuncturist
Subject 3: female – 56 years-old; Occupation: Retired School Principal
Subject 4: female – 52 years-old; Occupation: Energy Healer
Below are some general guidelines for reading the scans:
Guidelines For Reading GDV Programs
All of the programs show the collective energetic emissions surrounding the 10 fingertips. Each finger relates to a sector or system of the body, based on years of research. The measured data is then displayed through various software programs in the GDV software package.
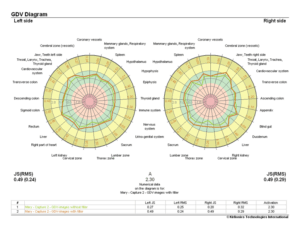
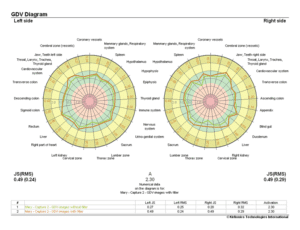
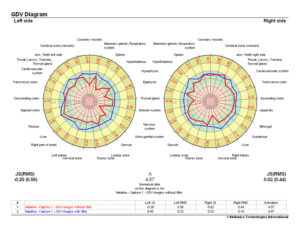
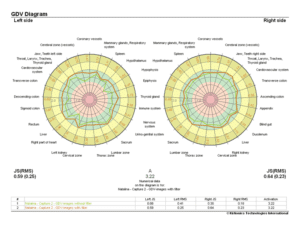
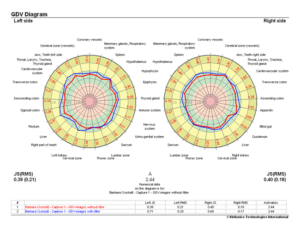
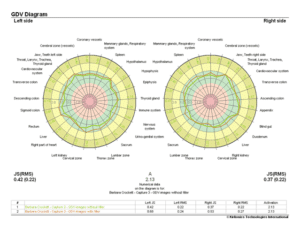
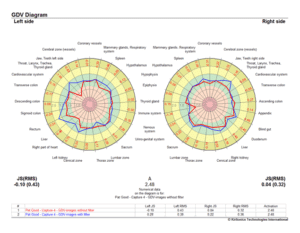
GDV Diagram
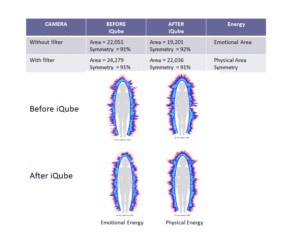
This program measures the overall emission strength in each of the general organ systems. The left side relates to the past and long-standing issues as well as the right brain, and the right side relates to the present day and the left brain. The emotional (without filter) and the physical (with filter) circles should be as close together as possible. Gaps between the physical and emotional circles indicate a potential conflict. The letter “A” in the center of the picture is for the anxiety level. Between 2-4 is a normal stress level. All levels in the green area are normal energy, the pink ring is deficient energy, and gold is hyper-energy. Generally, the physical energy is stronger than the emotional energy.
The Area is the total amount of emissions, and Symmetry is the left to right side energy balance.
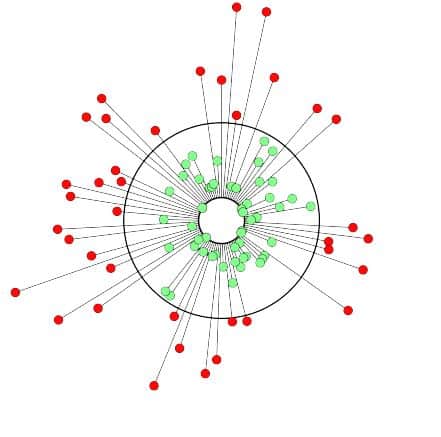
GDV Energy Field
The Energy fields show the collective measurements of the energy surrounding the fingertips as they are physically located on the body. The measurement “without filter” shows the emotional state of the person and “with filter” shows the physical state. The emission should be even around the entire body; gaps indicate low energy in that area, and spikes show excessive energy.
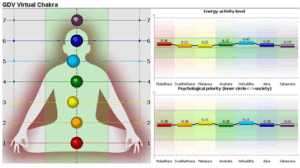
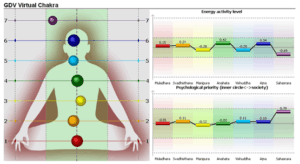
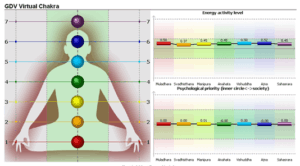
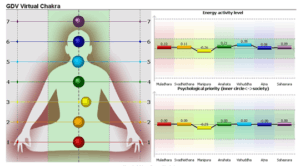
GDV Virtual Chakra
The Chakra program provides a deeper interpretation of the emotional priorities of the subject and is calculated without the filter. Perfect alignment occurs with all of the large spheres in alignment on the centerline. Perfect alignment means merely that the subject is satisfied with where they are at emotionally in life. Smaller spheres indicate low energy centers. Chakra spheres skewed to the left side of the body picture relate to focusing the emotional energy towards self, or inner circle. The spheres skewed to the right side of the body picture indicate focusing the emotional energy towards the outer circle, or community.
GDV Testing Summary SUBJECT #1
Female – 56 years-old; Occupation: CEO, Master Acupuncturist & Colorpuncturist
GDV Diagram (Before iQube)
GDV Diagram (After iQube)
The issues that were affected by the iQube were:
The emotional energy became more balanced and the higher spikes (unbalanced) physical energy decreased. Based on the GDV Diagram readings, the Activation Coefficient (STRESS LEVEL) decreased significantly, and the laterality (left-right brain balance) improved.
GDV Energy Fields (Before & After iQube)

GDV Chakra (Before iQube)
Chakras 3 & 5 are moving towards community; the desire to speak to others.
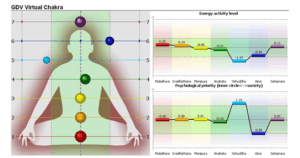
GDV Chakra (After iQube)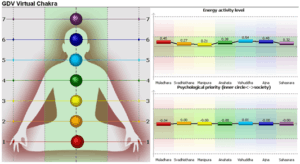
The Chakras show better alignment and energy.
GDV Testing Summary SUBJECT #2
Female – 42 years-old; Occupation: Registered Nurse & Master Acupuncturist & Colorpuncturist
(The subject’s long fingernails produced false readings in the coronary & cerebral vessels.)
GDV Diagram (Before iQube)
GDV Diagram (After iQube)
The issues that were affected by the iQube session:
Based on the GDV Diagram readings, the Activation Coefficient (STRESS LEVEL) decreased significantly, and laterality improved. Energy levels showed a decrease in stress in the cerebral and coronary vessels, which may have to be ignored due to the long fingernails.
GDV Energy Fields (Before & After iQube)
GDV Chakra (Before iQube)
Zig-zag pattern of Chakras indicates high-stress state. Chakra #7 shows the subject trying to gather information from other sources.
GDV Chakra (After iQube)

Chakras are more aligned.
GDV Testing Summary SUBJECT #3
Female – 56 years-old; Occupation: Retired School Principal
GDV Diagram (Before iQube)
GDV Diagram (After iQube)
The issues that were improved by the iQube swim were:
Based on the readings of the GDV Diagram, the Activation Coefficient decreased, and the laterality became slightly less balanced. Emotional and physical energy became more balanced in all systems with the exception of the throat and sacrum.
GDV Energy Fields (Before & After iQube)
GDV Chakra (Before iQube)
All chakras aligned.
GDV Chakra (After iQube)
All chakras still aligned.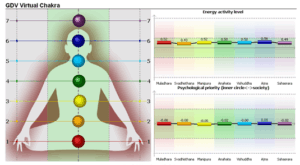
GDV Testing Summary SUBJECT #4
Female – 52 years-old; Occupation: Energy Healer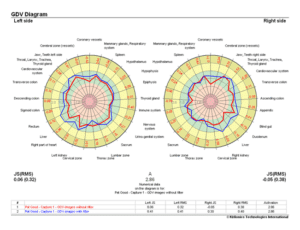
GDV Diagram (Before iQube)
GDV Diagram (After iQube)
The issues that were affected by the iQube session were:
Based on the readings of the GDV Diagram, the Activation Coefficient (Stress level) decreased and the laterality improved.
Energy readings improved in the jaw & the liver (emotionally).
The subject was extremely sensitive to surrounding energy, including a 10-foot pyramid which was in the exhibit hall.
GDV Energy Fields (Before & After iQube)
GDV Chakra (Before iQube)
Chakra #3 (towards inner circle).
GDV Chakra (After iQube)
Chakras shifting as healing changes take place. Subject using her intuition, but talking about herself to others.
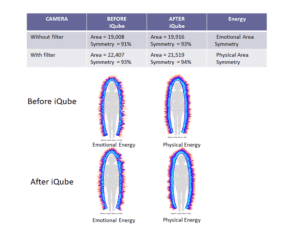
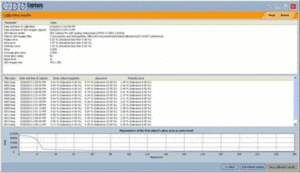
GDV Camera Calibration Data
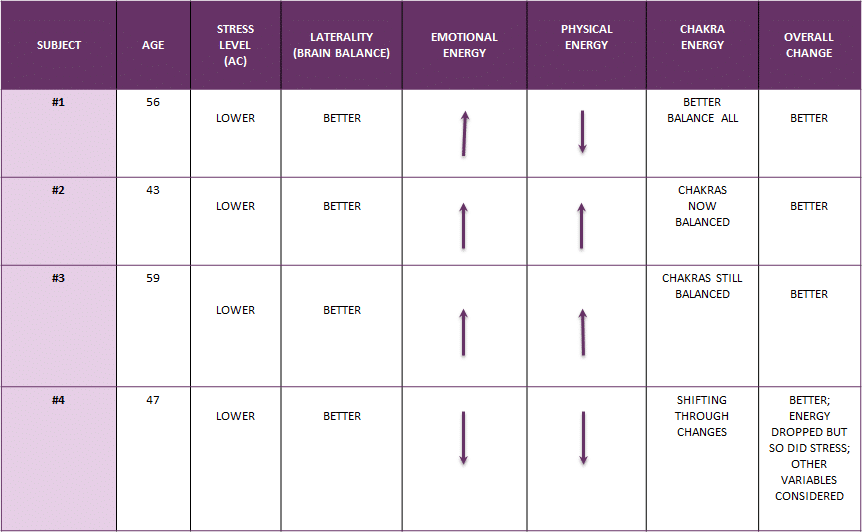
Final Analysis Summary Chart
Conclusions
The measurements taken after a session with the iQube provided scientific proof that the stress levels were reduced, and emotional and energy fields increased after the therapy. All of the four subjects participating in the pilot study showed noticeable energetic improvements, as is summarized in the chart. Despite the fact that the data was collected at a well-attended Energy conference, as opposed to ideal research conditions, the results obtained from the pilot study were still significant.
The subjects may have also further improved over time, but this measurement was not taken.
Recommendations
The pilot study should be expanded as a formal study using a larger sample size as well as a control group. Measurements should be made before, shortly after, and again at least 1-2 hours after using the iQube in a quiet, clinical setting. Measurements should also be made over a sustained time interval to measure the long-term efficacy of the therapy.
Further, additional comparative studies should be taken measuring the effects of using comparable scalar or other energy balancing therapies
Comparative studies of this depth would provide significant validation in marketing and promoting the healing and balancing energy received from using the iQube!
Warm Regards,
CEO, GDVsource

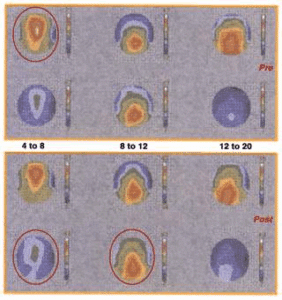
The subject has extreme Attention Deficit Disorder (ADD). He is right brain dominant, has colitis, allergies, and various other health challenges. It is my belief that the high mental activity (the white spot in the top left-hand image) prevents the body from settling down and going through the natural healing process. He simply has too much mental activity (inner chatter) going on all the time.
However, our system does not simply beat two frequencies; the output waveforms are complex and contain more than simply two waveforms. We generate a complicated interference pattern comprised of more than 6 waveforms and the interference pattern thus generated exhibits dynamic shifting in four-dimensional space (the three spatial dimensions and time). By the use of a phasing equation, we are able to manipulate the Scalarwave energy construct so that it maximizes the impact on the receiving system – the user.
Using our computer software we generated a generic alpha – Theta program and played it through the round MiraCoil using pure sine waves with sine wave modulation. We see a shift from the right hemisphere to the left and a major improvement in the front area of the brain. We see the high-frequency white spot completely removed in the post-test indicating he is experiencing greater levels of rest and coherence.
The increased Delta readings do not normally occur and indicate cellular stimulation. This brain map is a perfect example of how the technology can take a dysfunctional brain pattern, settle down the mental activity and show an improvement one hour later.
If we had used the computer system and played back his personal tones we would have seen an even greater improvement. Since this test was done, we have created the triangle, square, pentagon and hexagonal Scalar Vortex Miracoils. It is quite obvious that the Miracoil Technology offers an alternative to stress management that deserves further investigation.
NMR is a non-invasive way to look at molecules – their composition shape and motion.
The NMR linewidth value reflects the potential interaction between water in its different physical shapes. The narrower (or smaller the value of) the linewidth, the less the water molecules are changing physical states or environments. Water samples with narrow (or small) line widths (FWHH) therefore have a more static (non-changing) and stable physical environment of the liquid water molecules that comprise it.
The 170 – NMR for normal tap water usually measures between 85 and 150 Hertz, indicating an unorganized state of the water and a cluster size of (H2O)12-13. Hexagonal Water usually measures between 60 and 70 Hz. indicating a higher percentage of 6 ring structures (H2O)6.
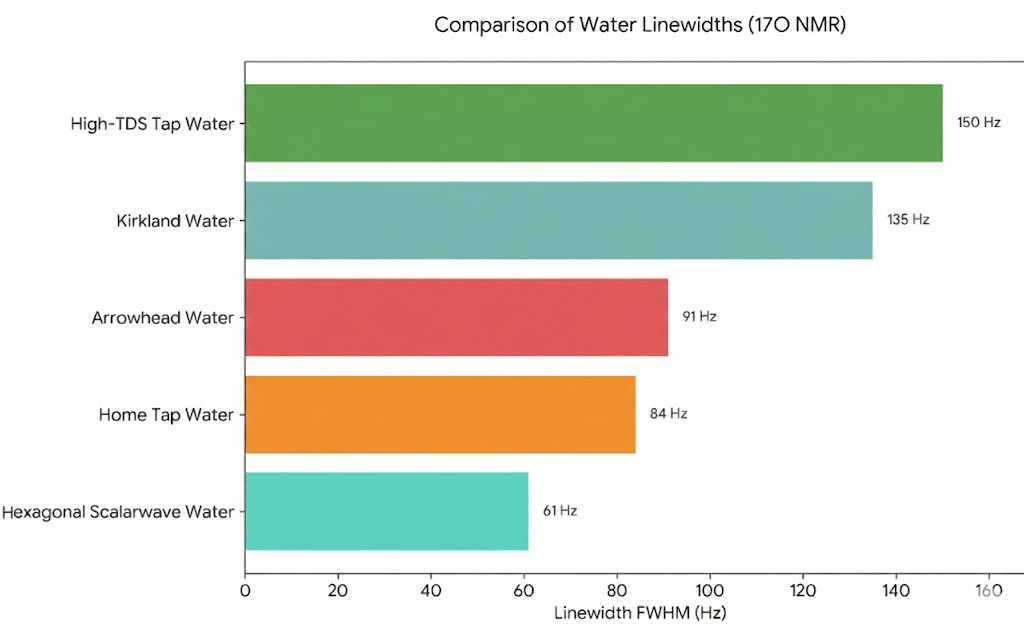
Our Hexagonal Scalarwave Structured Water produced an MNR reading of 61 Hertz. We only use distilled water in our water structuring process. The NMR change to 61 indicates that we took a very disordered distilled water and converted it to extremely coherent water using our Scalarwave Technology.
You must mix distilled water with our structured concentrate. You must start with water that has been stripped of memory (distilled). When you mix distilled water with our concentrate it is converted to structured water. The new structured water produces a perfect geometric crystal structure. Our crystals images were created in Japan from the “Purity/Clarity”, “Super”, “Supercalm” and “Indigo” concentrates.
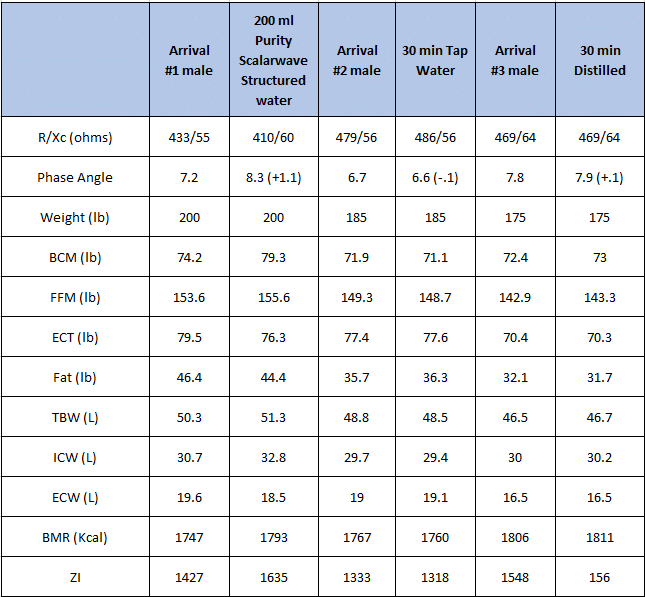
Test using Purity/Clarity Structured Water
Male #1 has been drinking Scalarwave Structured water. He drank 7 ounces of Purity Scalarwave Structured water
Male #2 has not been drinking Scalarwave Structured water. He drank 10 ounces of tap water
Male #3 has not been drinking Scalarwave Structured water. He drank 10 ounces of distilled water
We performed a test to show what happens when you drink Purity Scalarwave Structured water, tap water, and distilled water. The tests show that when we drink normal tap water the readings went down indicating that the water did not change the Intracellular Water or Extracellular Water during the 30-minute test.
The chlorine etc. in the water is actually harmful to your Phase angle (general health condition). When you look at the photos of tap water or distilled water, it becomes obvious that they would be very slow and inefficient at hydrating the cells and flushing toxins from your system.
In the case of distilled water, the readings made little or no change. Even still, it indicates that you are better off drinking dead (without memory) distilled water than tap water.
In the case of Purity Scalarwave Structured Water, the net cell water jumped by 2.1 liters in 10 minutes although only 200 ml of Purity Scalarwave Structured water was consumed. In other words, less than 7 ounces of Purity Scalarwave Structured water caused the cells to flush and pump over 1/2 a gallon of cell water. Every test shows improvement after drinking 200 ml of Purity Scalarwave Structured water.
No other solution has been able to produce these dramatic changes. Our perfect hexagonal scalarwave structured water proves it is capable of transporting nutrients and removing toxins from the cells. 2nd test was taken 30 minutes after consuming solutions.
Phase Angle
The Key Points are
The net cell water jumped by 2.1 liters. In other words, less than 7 ounces of Purity Scalarwave Structured water caused the cells to flush and pump over 1/2 a gallon of cell water. Every test shows improvement after drinking Purity hexagonal Scalarwave Structured water.
What is Phase Angle
Phase angle is based on total body resistance and reactance and is independent of height, weight and body fat. Lower phase angles appear to be consistent with either cell death or a breakdown of the cell membrane. Higher phase angles appear to be consistent with large quantities of intact cell membranes and body cell mass. All living substances have a phase angle. In fresh uncooked vegetables, phase angle can exceed 45 degrees. In cooked vegetables, the phase angle is zero because they are dead.
Why is Phase Angle Important
Phase angle is a predictor of outcome and indicates the course of disease and increases as the result of optimal health based on good nutrition and constant exercise. As we get older phase angle will decrease and will be approximately 4 or less when we die. Fit adolescents may have a phase angle greater than 10. This effect is a result of cell integrity due to age. Good fitness and lifestyle is the key to maintaining a healthy phase angle.
Low Phase Angles are consistent with:
1. Malnutrition
2. HIV/AIDS infection
3. Cancer (most types)
4. Abusive lifestyle
5. Chronic Alcoholism
6. Old Age (80 – 100 years)
If the fluid you drink is not able to hydrate and flush the toxins from your cells then your health and welfare are subject to these pollutants. Depression etc. is a direct result of toxin buildup. The battle to hydrate cells must be considered as the first line of defense to your health and feeling of well being.
What is Parallel Capacitance
All living things are made of cells. Cells are membrane-bounded compartments filled with a concentrated solution of chemicals and salts. Groups of cells perform specialized functions and are linked by an intricate communications system. The cell membrane maintains an ion concentration gradient between the intracellular and extracellular spaces. This gradient creates an electrical potential difference across the membrane which is essential to cell survival. Electrical gradients are necessary to support the movement of oxygen, carbon dioxide, and nutrients. Therefore, the cell membrane has electrically insulating qualities of capacitance.
Electrical capacitance will increase or decrease depending on the health and the number of cells. Damage to the cell membrane and its functions is as lethal to the cell as direct damage to the nucleus itself.
Parallel Capacitance
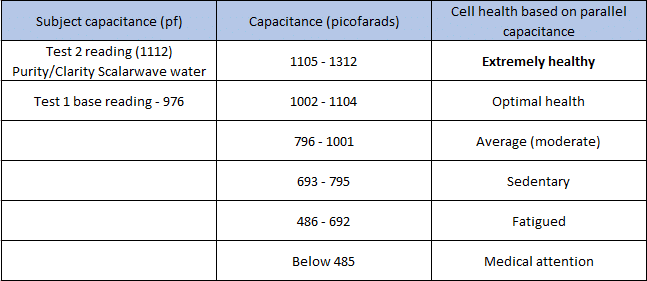
The subject’s Parallel Capacitance, which measures the cell membrane’s health jumped to 1112 picofarads ten minutes after drinking Purity Scalarwave Structured water. This reading indicates an extremely healthy individual. As we get older these reading go down and deteriorate but the tests indicate the subject compares to a super active and healthy 8 to 10-year-old child.
Why is Parallel Capacitance important
The cell membrane functions as a permeable barrier separating the intracellular (cytoplasm) and extracellular components. The lipid membrane is transversed by proteins which are soluble in water thus making pores which water, ions and other chemicals can enter and exit the cell.
*Note to readers: At the time the research was conducted (prior to the VAHS community being associated with the FSHLB, we were using the terms Hexagonal Scalarwave Structured Water. We have now changed that language to “Sacred Scalar Water.”
Purpose of the Proposed Study
The purpose of these case studies was to evaluate the consumption of Hexagonal Scalarwave Structured water on human subjects. The effects of structured water are certainly not a new topic. Three of five Noel Prize winners during the 1990s won their research in the field of structured water. They discovered that optimal healthy DNA is surrounded, and fully hydrated, by a matrix of water that is structurally different from tap water. Each researcher demonstrated that structured water appears to receive and transmit electromagnetic energy. Structured water molecules are able to hold more efficiently, the vibrations that power every cell function and structure. It was further found that structured water hydrates cells while flushing out toxins.
Research Strategy
A series of single-subject case studies was conducted. The purpose was not to record changes in reported symptoms, rather to determine measurable changes in energy vitality as a result of consumption of Hexagonal Scalarwave Structured water. While case studies appear to be slightly more sophisticated than testimonials, single subject research is usually not intended to prove anything, rather to suggest that the phenomenon that is observed is strong enough to warrant the need for larger more controlled studies.
Testing Device
The Biopulsar Reflexograph® developed by Martina Gruber was selected as the measurement device. The instrument measures skin resistance in the reflex zones of the palm of the left hand. The device measures the meridians (or the energetic systems of the body) which are connected with inner organs. All measurements were completed in real time. Contrary to the set up illustrated, none of the subjects were allowed to view the data screen.
Dr. Karl Erdt, physician and surgeon in Mengkofen, Germany has been using the device since 1998.He stated, “for me, the measuring of the palm reflex zones is similar to positron-emission-tomography, the functional magnetic resonance imaging (MRI) and the spectral analysis of the brain parameters in the EEC” (Metmari, 2001).
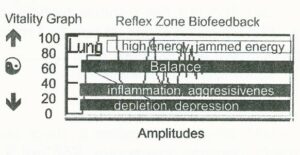
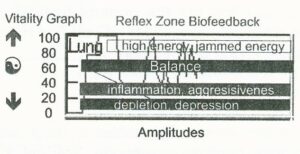
Vitality Measurement
The Biopulsar Reflexograph® measures the amplitudes related to specific reflex zones. As illustrated on the sample graph, amplitude values between 80 and 100 represent high or jammed energy. Values in the range of 60 indicate an energetic balance of the organ or structure. Values in the 20 to 40 range indicate a tendency for inflammation. Values in the 0-20 range suggest an energetic depletion.
When graphs lines are straight without fluctuations, there is inner stability and harmony. Small amplitude fluctuations, appearing as “static” from time to time represent a higher sensitivity but the organ can retain its power even in situations of stress. When there are strong fluctuations and high amplitudes, then the energy status of the organ is very unstable. The suggestion here is that the power or vitality cannot be held in situations of stress, forcing that organ or structure to take energy from other vital organs. When the graph starts and drops slowly after a short time of measuring, there is chronic weakness in that specific organ or structure. Organs which are compromised then “borrow” energy from other systems and cellular structures.
The primary question behind this series of case studies was:
Methodology
Three subjects were initially tested using the Biopulsar Reflexograph®. Subjects were asked to keep a record of Hexagonal Scalarwave Structured water consumption and the number of ounces of other fluids consumed. They were re-tested approximately 30 days later.
Subject Selection
Subjects were selected from an available sample of clients who volunteered to be part of the clinical research and who had not previously been seen for any clinical intervention. Details of the client’s medical history, presenting symptoms and history of medications were not obtained until the end of the study. For ease in reporting data, client history has been presented before results of the study.
Subject 1 was a 44 year old white female. She volunteered to participate based on a problem with insomnia. She had medical diagnoses the previous year of stage III lymes disease, fibromyalgia, chronic fatigue syndrome, migraine syndrome and secondary diabetes insipidus. She reported she had gallbladder surgery. She had a pick line through which she received antibiotics for six months for treatment of lymes Disease. She was currently taking pain medications and a prescription for a pituitary disorder. During the last four years she reported she had been treated for a thyroid disorder, food sensitivities, an absorption disorder and intestinal problems. The subject reported that her father had high blood pressure, cardiac disease and died of lung cancer at age 58. She reported that her mother had high blood pressure, a hyperactive thyroid, a history of alcoholism and Type II Diabetes. Two of three sisters had high blood pressure and high levels of cholesterol. One of the two had been treated for colitis and depression.
Subject 2 was a 52 year old white female who came to the clinic with complaints of difficulties sleeping. She reported that she was a hairdresser and exposed to beauty salon toxins for 33 years. She reported she had absorption difficulties, allergies, and a memory disorder and was sensitive to humidity, head and cold. She had been diagnosed as having arthritis, fibromyalgia, diverticulitis and ulcerative colitis. She had a history of taking antihistamines, pain medications, muscle relaxants and antidepressants. She had a total hysterectomy and removal of a cyst of the left breast. She reported being in a car accident and having been treated by a chiropractor for whiplash. She reported her mother was severely ill with cancer. Both parents had been treated for depression. Both younger sisters had been treated for digestive disorders and colitis. The subject also reported she was in a very strained marital relationship and was not able to support herself financially due to the car accident. She was concerned that she would not be able to live independently. She reported feeling fearful for her own health as she could not afford medical treatment.
Subject 3 was a 71 year old white female. Her primary complaints centered on arthritic and spinal pain. She had three lumbar laminectomies, a total hysterectomy and surgery for removal of a cyst in her breast. She received chemotherapy for breast cancer. She had been diagnosed as having hypertension and diabetes. She was currently taking medications for pain, high blood pressure, high cholesterol, and diabetes. She also reported her tonsils and adenoids were removed as a child. This subject reported that her father had a heart attack and died at age 52. Her brother died at age 18 with complications related to leukemia. Her sister died at age 57 of an asthmatic attack. In addition to pain, she reported chronic fatigue, shingles and sleep apnea.
Results
Subject 1: Average of water daily consumption for 26 days
| Hexagonal Water | 28 oz |
| Other Fluids 51 oz | 51 oz |
| Total Daily Average 79 oz | 79 oz |
Graph 1 Before
Graph 1 illustrates marked amplitude fluctuations in the kidney and adrenal glands. Erratic readings are noted in cerebellum, cerebrum, forehead, pineal, mouth, upper arm, esophagus, and hip areas. All other readings are above the desired 60 range.
Graph 2 After
After 26 days of water consumption Graph 2 shows amplitude fluctuations only in the liver and adrenal glands. Overall energy appears more coherent. Several organ structures show an elevated reading.
Subject 2: Average of water daily consumption for 30 days
| Hexagonal Water | 35oz |
| Other Fluids | 19oz |
| Total Daily Average | 54oz |
Graph 3 Before
Graph 3 shows many minor amplitude changes in nearly every organ structure. Major fluctuations are seen in the ear, thyroid, stomach, and liver. Several structures show a decreasing slope or loss of energy – noted in the liver, large intestine, urethra, kidney, spine and knees. Considerable loss of energy is noted in the hip.

Graph 4 After
After 30 days of water consumption, Graph 4 shows there are few amplitude changes, mostly at the start of the reading, which may be related to a movement artifact. General overall energy appears more balanced. There are several readings in the 80-100 range.
Subject 3: Average of water daily consumption for 30 days
| Hexagonal Water | 27oz |
| Other Fluids | 39oz |
| Total Daily Average | 66oz |
Graph 5 Before
Graph 5 shows a general impression for this subject is there is marked loss of energy in nearly all organ structures indicted by a decreasing data slope. There are minor fluctuations noted in nearly all structures.
Graph 6 After
After 30 days water consumption Graph 6 indicates there is greater coherence and energy appears more stable, the exception being the cerebrum, kidney and spine.
Discussion
Results indicate that all three subjects showed stabilization in energy levels after consumption of Hexagonal Scalarwave Structured water and other fluids. The greatest shifts were noted in the reduction of amplitude fluctuations. Shifts do not appear age related as subjects 1, 2 and 3 were 44, 52 and 71 respectively. Nor can an assumption be made with respect to chronicity as all made considerable changes despite multiple diagnoses. Even though Subject 1 consumed fluids, results cannot be attributable to hydration alone.
The primary question has been answered by sufficient change in individual energy levels to warrant more detailed and controlled studies.
Purpose of the Study
The purpose of the study was to do a more detailed analysis of the immediate effects of consumption of Hexagonal Scalarwave Structured water using a single female subject.
Testing Device
The Biopular Reflexograph® was again used to measure the reflex zones in the palm of the left hand.
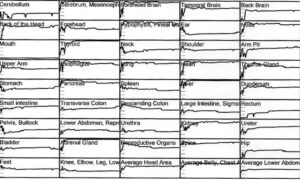
Record of the vitality status of Organs
The vitality graph consists of a series of boxes containing a measure of each part of the body associated with a respective sensor on the Biopulsar. The vitality graph contains a series of boxes associated with specific organ structures and measured on a scale from 0 to 100. For this particular study a green health band was added at the 60 level to more clearly indicate the degree to which the body was in balance.
When the line is straight and does not show amplitude fluctuations, there is inner stability and harmony. A jagged line is a measure of amplitude changes, much like “static” in a system. When there are small amplitude shifts from time to time then there is a high sensitivity indicating a responsive structure. With strong fluctuations and high amplitudes the energy status of the organ is very unstable. This means that in times of stress, the energy drops and in order to rise again, it must take energy from other organ structures. If the energy starts at a specific vitality point but drops slowly over time, there is chronic weakness in that specific organ. When some boxes show high energy and some low energy, the organs do not pulsate in harmony with each other.
Readings in the 0 to 20 range indicate a severe depletion of energy so that the organ may not be able to function or that there is emotional and mental depression. A Reading between 20 and 40 is an indication of inflammation in the organ, or mental and emotional aggressiveness. If the line is in the 80-100 range it is an indication that the energy is blocked.
Subject Description
The subject was a 58 year old white female. The client reported a frozen left shoulder, cramps in both feet, and surgery for removal of a thyroid tumor. She had a history of allergies, malabsorption problems, childhood hyperglycemia and a loss of hearing; wearing hearing aids since childhood. She was currently taking medications for high blood pressure and Tegretol, an antidepressant. She stated she had been exposed to herbicides, insecticides and had 25 mercury fillings. She also mentioned the use of beauty shop products, particularly hair coloring. She reported being farsighted in both eyes and wore corrective contact lenses. She reported pain above the left scapula, below the right scapula and in the soles of both feet. Client stated she usually consumed about 2 glasses of water daily and estimated she was 40 pounds overweight.
Methodology
The subject was asked to make her appointment at mid-morning following her regular routine of breakfast. The intent was to determine her customary level of hydration. She stated she consumed two
cups of coffee and a glass of orange juice. She had two eggs and buttered toast. Upon arriving in the clinic she consumed one 8 ounce glass of Hexagonal Scalarwave Structured water. She was retested after 20 minutes for energetic changes.
Results
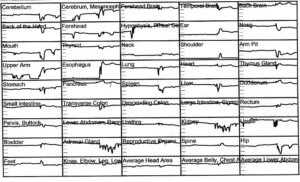
Results shown in Graph 7 show a great deal of disorganization when looked at as a body as a whole. There are many minor fluctuations indicating those organ structures are very sensitive to change. There is also a characteristic downward slope suggesting organ structures cannot maintain their function over time. In addition, readings in the forehead, temporal and back brain are in the 80-100 range indicating severe stress.
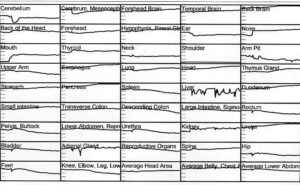
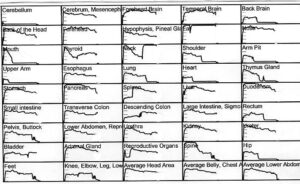
Results shown in Graph 8 following consumption of Hexagonal Scalarwave Structured water indicate a major reorganization of the energy in all organ structures measured. The graph is characterized by nearly a complete lack of amplitude fluctuations. Only the cerebellum, mouth, neck, shoulder, armpit and spine show readings below the desired 60 range. Only the forehead and temporal brain have an indication of readings in the 80-100 range.
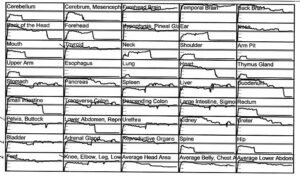
Graph 7 Before
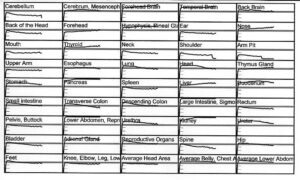
Graph 8 After
Discussion
Given that the subject stated she normally drinks two 8 ounces of water daily, one can assume her chaotic readings are a result of chronic dehydration. Either that or she is not counting juice and coffee as part of her “normal” intake of fluids. In either case, given no other intervening variables, the data suggests that the Hexagonal Scalarwave Structured water was responsible for her marked energetic changes.
This research raises some interesting questions and challenges some myths about the body and its capacity for change. First, with these many changes in a 20 minute period of time, one has to challenge the myth that healing is a “matter of time.” The degree of individual organ change and whole body re- organization also suggests that as health practitioners, we need to question notions we have held about chronicity and the inability of the body to make rapid changes.
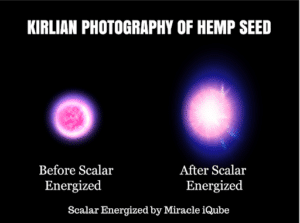
The summary of results from below is based on the application of the Miracle iQube technology to a 3,000 Acre Canadian Farmer.
One of our clients, who is a Canadian hemp farmer purchased the Miracle iQube about six years ago. He uses the scalar energy to activate both the seeds and the crops. He also uses the scalar technology to infuse the plants with high-frequency information while growing. The scalar Miracle iQube technology fits in a 21-inch Pelican Suitcase.
His 3,000-acre Alberta Canada Farm has yielded the following results over a six year period:
He believes that the scalar vortex that is created is not attractive to bugs and pests (too high frequency). Also, the health of the roots of the plants results in less vulnerability to environmental challenges such as not enough water. He does not irrigate so his crops are particularly vulnerable to water shortages and heat.